
- Mean is Amazon's best estimate of weekly customer demand and excludes safety stock. P70, P80, and P90 express the probability that demand stays at or below the forecast value.
- Choose the forecast statistic as an approved policy per ASIN or service class. Refresh its values weekly without changing the policy because one readout moved.
- The ARA forecast is unconstrained customer demand, not a promise of purchase orders. Amazon accounts for on-hand and on-order units before issuing a purchase order.
- Compare the same calendar week across snapshots. Keep the 47-week dashboard, the API mapping's 26-week Mean annotation, and the 52-week Direct Fulfillment forecast as separate surfaces.
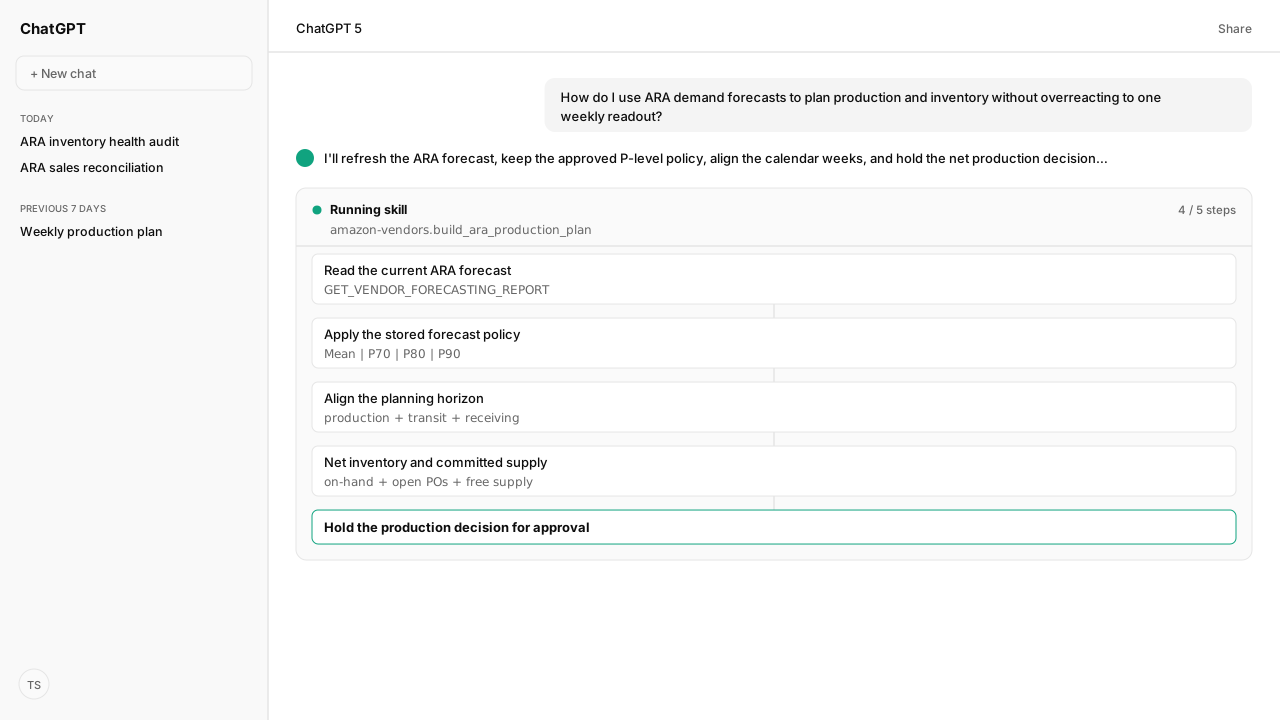
An Amazon P70 forecast is one policy choice, not a default for every ASIN. Set one Amazon Retail Analytics forecast policy per ASIN, sum the matching weekly demand buckets across your real production-to-receipt horizon, then net that demand against stock and supply already committed. The agent pulls GET_VENDOR_FORECASTING_REPORT through the Amazon Vendor Central MCP as a recurring Skill.
Amazon Agent Atlas grounds what Mean, P70, P80, and P90 actually mean before the plan reaches production.
The planning question came from a weekly meeting: “How do I use ARA demand forecasts to plan production and inventory without overreacting to one weekly readout?” The answer is to separate three decisions that the dashboard puts next to each other:
- Choose the risk posture once.
- Read demand at that posture every week.
- Reconcile the demand against supply without pretending the forecast is a purchase order.
ChatGPT, Claude, Perplexity, and Microsoft Copilot know nothing about your business out of the box, and your competitors use the same tools. Kuudo gives those tools your data, your rules, and your way of working: your account as it is right now, your judgment running every time, and your call before anything changes.
- The Vendor Central MCP supplies the current reports. It is built on the vendor side of the Selling Partner API, and a brand that also sells on Amazon connects the Selling Partner MCP beside it.
- Skills preserve the planning rule.
- Atlas supplies the Amazon-specific definitions.
- Approval controls keep the production decision with the operator.
| Forecast statistic | What Amazon says it represents | What the Skill records |
|---|---|---|
| Mean | Amazon's best estimate of weekly customer demand in most instances; the ARA Mean metric excludes safety stock | The baseline demand case |
| P70 | A value that weekly customer demand has a 70% probability of staying at or below | A 70% demand-coverage policy |
| P80 | A value that weekly customer demand has an 80% probability of staying at or below | An 80% demand-coverage policy |
| P90 | A value that weekly customer demand has a 90% probability of staying at or below | A 90% demand-coverage policy |
The P-level is a policy choice, not this week's answer
The first thing I asked our agent to return was not a production quantity. It was the forecast policy attached to each ASIN. The amazon_vendors Amazon Retail Analytics playbook defines the Forecasting dashboard as a production and inventory planning surface, then defines its confidence levels, also called critical ratios. The metric glossary gives the field-level reading: P70, P80, and P90 are estimates that weekly customer demand will be at or below the stated value with the corresponding probability.
Mean is different. Amazon describes it as its best demand estimate in most instances based on available data, and the ARA glossary says the weekly Mean forecast does not include safety stock. Mean is therefore a demand estimate, not a low-inventory policy. A plan built on Mean still needs the operator to decide how much uncertainty the business is willing to carry.
Amazon gives P80 a second operational explanation: an 80% probability that the ASIN will be in stock for the buying horizon. It also says a higher critical ratio or P-level means more buffer stock. Those statements make the trade clear without choosing it for the operator. P90 asks the business to carry more inventory than P70 because it covers a larger share of the estimated demand distribution. It does not promise an outcome.
Store the policy outside the weekly pull
The Skill keeps the choice outside the weekly data pull. Each ASIN or service class has a stored forecast_policy, the reason for it, and the person who approved it. The rule can use the business's own inputs, such as the cost of stocking out, shelf life, minimum production runs, substitution options, and the cost of carrying excess. None of those inputs comes from Amazon, so none is quietly inferred from a P-level.
forecast_policy:
  scope: "ASIN or service class"
  statistic: "Mean | P70 | P80 | P90"
  reason: "operator-owned tradeoff"
  approved_by: "named approver"
  change_rule: "review when the business tradeoff changes"
  weekly_behavior: "refresh forecast values; retain statistic"
That last line prevents the familiar reaction to a noisy readout. A forecast revision changes the quantities that enter the plan. It does not, by itself, change the probability policy used to read them.
The forecast is customer demand, while the purchase order is net demand
The most expensive mistake in this workflow is treating the Forecasting dashboard as an early purchase order. Amazon says twice that the forecast represents unconstrained customer demand and is not a promise of purchase orders. It also explains why the numbers diverge: on-hand or on-order units available to cover demand are considered when the system issues purchase orders.
That means a forecast of demand and an open purchase order answer different questions. The forecast asks what customers may demand. The purchase order asks how much more inventory Amazon currently wants from the vendor after its own supply position is considered. A lower purchase-order quantity does not disprove the forecast, and a high forecast does not authorize production by itself.
I had the agent keep the layers visible in the decision artifact. The target demand comes from the selected forecast statistic over the operator's planning horizon. Amazon-side coverage comes from on-hand inventory and open purchase orders. Vendor-side coverage comes from finished goods and work in progress, separated into inventory already committed to an open purchase order and inventory still free for new demand. That separation keeps the same units from being subtracted twice.
{
  "asin": "[ASIN from report]",
  "forecast_policy": "P80",
  "forecast_snapshot": "[report retrieval date]",
  "planning_horizon": {
    "production_weeks": "operator input",
    "transit_weeks": "operator input",
    "receiving_weeks": "operator input"
  },
  "selected_demand_units": "sum of aligned weekly P80 values",
  "amazon_coverage": {
    "on_hand_units": "current report value",
    "open_purchase_order_units": "current report value"
  },
  "vendor_supply": {
    "finished_goods_uncommitted": "operator input",
    "work_in_progress_uncommitted": "operator input",
    "work_in_progress_committed_to_open_po": "tracked, not subtracted twice"
  },
  "production_decision": {
    "incremental_units": "calculated from the approved netting rule",
    "action": "hold | increase | reduce | review",
    "approval": "required"
  }
}
The arithmetic belongs to the business because the supply categories and commitments belong to the business. Atlas does not invent a lead time or decide whether work in progress is movable. It prevents the upstream category error: using an unconstrained demand forecast as though it were a commitment from Amazon.
Calendar weeks keep forecast revisions comparable
Weekly forecasts shift one column to the left every time the dashboard refreshes. “Week 4” in this week's pull and “Week 4” in next week's pull refer to different customer-demand weeks. Comparing those column labels produces a change where none may exist and hides a revision where one did.
The Skill stores every value against the calendar week it forecasts, along with the snapshot date and statistic. It compares the same demand week across snapshots, then separately rolls the planning horizon forward. That produces two useful signals: how Amazon revised its estimate for a fixed week, and how the production requirement changed because a new week entered the horizon.
The source surfaces also carry different documented horizons:
- The ARA metric glossary defines Week 1 through Week 47 Mean, P70, P80, and P90 metrics in the Manufacturing view.
- Amazon's EDI/API mapping names
meanForecastUnitsfor weeks 1 through 26 underGET_VENDOR_FORECASTING_REPORT, withp70ForecastUnits,p80ForecastUnits, andp90ForecastUnitson the same report. - The Direct Fulfillment forecast is a separate 52-week surface.
Treating all three horizons as interchangeable would create rows that no source promises.
The production horizon is shorter and owned by the operator. The Skill adds production, transit, and receiving time using values the team supplies, selects the calendar weeks that fall inside that combined horizon, and sums the approved statistic across those weeks. It does not hard-code an Amazon horizon as the factory's lead time.
{
  "snapshot_date": "[report retrieval date]",
  "forecast_statistic": "P80",
  "weeks": [
    {
      "calendar_week": "2026-W41",
      "forecast_units": "report value",
      "prior_snapshot_units": "prior report value",
      "revision_units": "current minus prior for the same calendar week",
      "inside_production_horizon": true
    }
  ],
  "horizon_change": {
    "new_week_entering": "2026-W45",
    "week_leaving": "2026-W40"
  }
}
Now one large change has a name. It is either a revision to the same week, the normal roll of the horizon, or a policy change. Only the first two belong in the weekly refresh. The third needs approval.
Direct Fulfillment demand stays in its own forecast branch
Vendor Inventory Forecast (VIF) looks similar enough to the retail forecast to invite a bad addition. Amazon says VIF is the Direct Fulfillment subset of the retail forecast, provided at ASIN level. It is not extra demand to add on top of the retail number.
VIF answers a different allocation question. It covers the next 52 weeks, updates weekly, and breaks Direct Fulfillment demand out by warehouse or across nine US regions. A regional view can show demand where the vendor has no warehouse today; a warehouse view allocates demand to the warehouse network that exists. For dual-offer ASINs, Amazon says VIF takes fulfillment-center inventory into consideration.
The access path is also different. The VIF FAQ says the report is available only as a manual CSV or Excel download in Vendor Central. GET_VENDOR_FORECASTING_REPORT is the programmatic ARA retail forecast surface; it is not a hidden VIF API. The Skill therefore keeps two branches:
| Branch | Scope | Grain and horizon | Ingestion | Planning use |
|---|---|---|---|---|
| ARA retail forecast | Comprehensive Amazon customer demand, including Direct Fulfillment | Weekly ARA forecast fields | GET_VENDOR_FORECASTING_REPORT | Production requirement by ASIN |
| Vendor Inventory Forecast | Direct Fulfillment subset only | Weekly, 52 weeks | Manual CSV or Excel from Vendor Central | Warehouse and regional allocation |
The manual VIF file can still enter the workflow. The operator downloads it from Vendor Central, and the Skill can ingest the approved export once it lands in the customer's storage. What the workflow cannot do is describe the manual report as an API pull or add the subset to its parent.
What happens next: run the plan as a weekly Skill against a dated snapshot
The finished artifact becomes a weekly Skill. The Vendor Central MCP requests GET_VENDOR_FORECASTING_REPORT, the data layer appends a dated snapshot, and the Skill aligns calendar weeks, applies the approved forecast policy, nets the demand against current coverage, and holds the revised production plan for review. The Amazon Ads MCP can add promotion and spend context beside that plan, while demand, purchase orders, and media remain separate facts.
Three exceptions fork out of the weekly run, and each leaves the forecast with its meaning intact:
- Rows that need a supply diagnosis link back to the ARA inventory health audit.
- Rows that need warehouse allocation fork to the manual Direct Fulfillment forecast.
- A changed P-level forks to policy approval.
A production plan gets steadier when the team fixes the decision rule and lets the inputs move. The forecast will change every week. The meaning of the fields and the business's risk posture should not change with it.
Next: Amazon Retail Analytics Sales: Compare Views so the production plan and actual demand use the same reporting clock.
Turn your forecast policy into a weekly production decision
Bring us the ARA forecast your team keeps re-reading. We will map the Vendor Central MCP report pull, the planning Skill, Atlas grounding, and private-beta setup with you.
Run this workflow in betaWhat you need to run ARA demand forecast planning
- MCP
- Amazon Vendor Central MCP, through the shared Selling Partner Reports tools: Reports_createReport, Reports_getReport, and Reports_getReportDocument against GET_VENDOR_FORECASTING_REPORT and GET_VENDOR_INVENTORY_REPORT
- Skill
- A reusable ARA production planning Skill that stores the approved Mean or P-level policy, aligns calendar weeks, nets current coverage, and holds production changes for approval
- Atlas collection
- amazon_vendors, the rule corpus behind the forecast definitions and report mapping (playbooks: Amazon Retail Analytics; Amazon Retail Analytics metric glossary; Amazon Retail Analytics EDI/API integration; Vendor Inventory Forecast FAQ)
- Required subscriptions
- A Vendor Central account with Manufacturing view for the Forecasting dashboard, plus the Brand Analytics role on the Selling Partner API developer profile for report pulls
- Last verified
- 2026-09-10
What success and failure look like for ARA demand forecast planning
| result | meaning |
|---|---|
| The purchase order is lower than the selected forecast | Expected when Amazon already has on-hand or on-order units. The forecast is unconstrained customer demand; the purchase order is issued after supply is considered. |
| Week 4 changed sharply between two report pulls | Compare the calendar-week labels first. Week 4 in consecutive snapshots refers to different demand weeks. |
| The Forecasting dashboard is missing | The Forecasting dashboard is displayed only to manufacturers. A Sourcing-only vendor view will not show it. |
| The Direct Fulfillment forecast will not pull through the API | Vendor Inventory Forecast is a manual CSV or Excel export. It is a Direct Fulfillment subset of the retail forecast, not GET_VENDOR_FORECASTING_REPORT. |
Keep exploring ARA demand forecast planning
Use these companion guides to understand the inputs, follow-on analysis, and adjacent workflows behind this playbook.
FAQ
What does P80 mean in the ARA Forecasting dashboard?
P80 is the forecast value that weekly customer demand has an 80% probability of staying at or below. Amazon also describes it as an 80% probability that the ASIN stays in stock for the buying horizon; it is a risk posture, not a promise.
Does the ARA Mean forecast include safety stock?
No. The ARA metric glossary defines the weekly Mean forecast as Amazon's best estimate of customer demand without safety stock. An operator using Mean still needs an explicit inventory-risk policy.
Why does the Amazon purchase order not match the ARA forecast?
The forecast is unconstrained customer demand and is not a promise of purchase orders. Amazon accounts for units already on hand or on order before it issues a purchase order.
Why did Week 4 change when I refreshed the forecast?
Week 4 moves with each weekly snapshot, so consecutive Week 4 columns represent different calendar weeks. Store the forecasted calendar week and compare that same week across report pulls.
Why can I not see the ARA Forecasting dashboard?
Amazon displays the Traffic, Net Pure Product Margin, and Forecasting dashboards only to manufacturers. A vendor with Sourcing view alone will not see Forecasting.
Is Vendor Inventory Forecast additional demand on top of the ARA retail forecast?
No. Vendor Inventory Forecast is the Direct Fulfillment subset of the retail forecast. It covers 52 weeks at warehouse or regional level and is available as a manual CSV or Excel export, not through GET_VENDOR_FORECASTING_REPORT.