
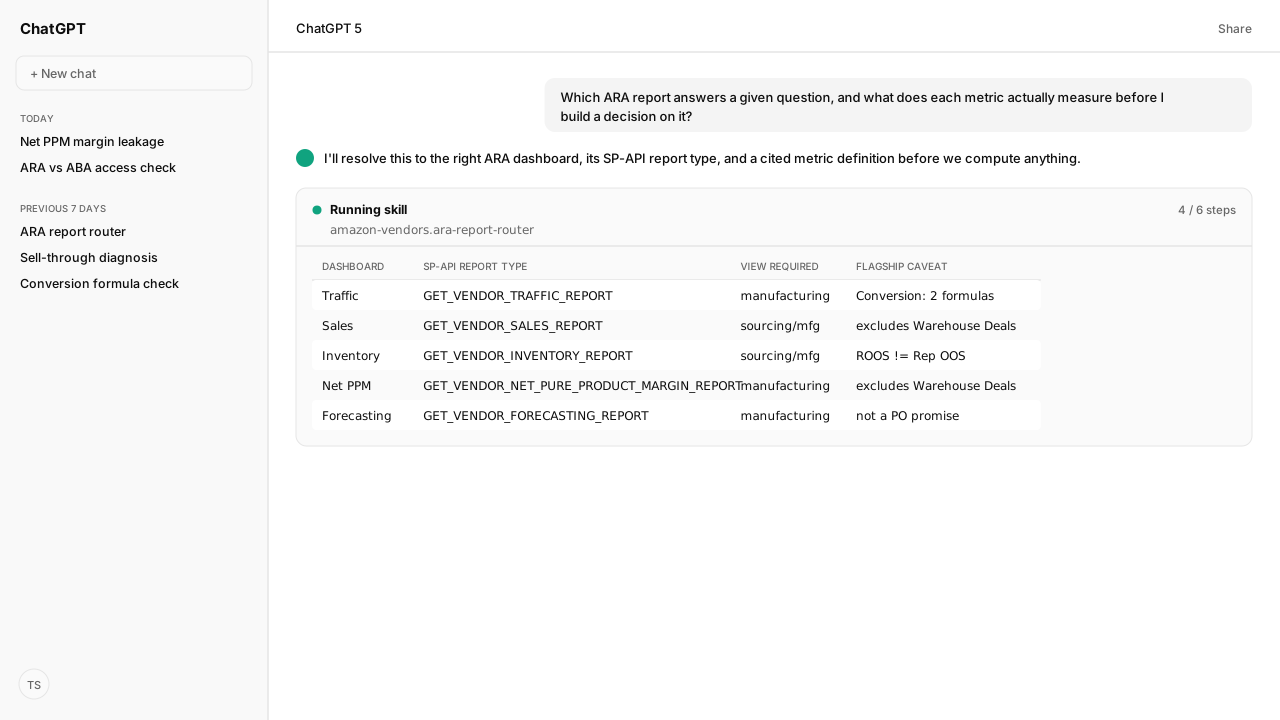
- Five ARA dashboards each have a matching SP-API report type: Sales → GET_VENDOR_SALES_REPORT, Inventory → GET_VENDOR_INVENTORY_REPORT, Traffic → GET_VENDOR_TRAFFIC_REPORT, Net PPM → GET_VENDOR_NET_PURE_PRODUCT_MARGIN_REPORT, Forecasting → GET_VENDOR_FORECASTING_REPORT.
- ARA needs no Brand Registry enrollment; ABA (Amazon Brand Analytics) requires Brand Registry enrollment and brand-selling responsibility, a different product with different dashboards.
- Amazon's own ARA overview page defines Conversion two ways: ordered revenue / glance views (Traffic dashboard section) versus ordered units / glance views (General dashboard information section). Net PPM is also written two ways across the overview and the metric glossary.
- ROOS, Rep OOS, and Sourceable Product OOS are three distinct metrics, not synonyms, and Traffic, Net PPM, Forecasting, ROOS, and Sourceable Product OOS are all Manufacturing-view-only.
- ARA excludes Warehouse Deals sales from its reported metrics, Sales and Net PPM included; returns and cancellations are applied to ordered revenue on the original sale date; ASIN-mapping fixes can take up to 14 days to reflect.
Amazon Retail Analytics (ARA) has five dashboards that each have a matching SP-API (Selling Partner API) report type: Sales, Inventory, Traffic, Net PPM, and Forecasting. An agent on the Amazon Vendor Central MCP, grounded by Amazon Agent Atlas, resolves a vendor's question to the dashboard, the report type, and Amazon's cited metric definition.
Vendor Central hands you a dashboard tab. A raw SP-API report hands you a payload of fields, not which field you needed or what its number means. Someone on my team asks why sell-through dropped, or what "Conversion" means in an export, and the honest answer depends on which report, which account view, and which section of Amazon's help you read.
ChatGPT, Claude, Perplexity, and Copilot know nothing about your business out of the box, and your competitors use them too. Kuudo gives those same tools your account as it is right now, your judgment running every time, and your call before anything changes. The Vendor Central MCP pulls the retail analytics reports, a Skill your team writes keeps the definitions you report against, Atlas supplies Amazon's cited guidance, and approval controls keep downstream decisions with you.
Five ARA dashboards have a matching SP-API report type, so naming the dashboard is only half the job
| ARA dashboard | SP-API report type | Retired EDI transaction |
|---|---|---|
| Sales | GET_VENDOR_SALES_REPORT | X12 852, EDIFACT SLSRPT |
| Inventory | GET_VENDOR_INVENTORY_REPORT | X12 852, EDIFACT SLSRPT |
| Forecasting | GET_VENDOR_FORECASTING_REPORT | X12 830, EDIFACT DELFOR |
| Traffic | GET_VENDOR_TRAFFIC_REPORT | None |
| Net PPM | GET_VENDOR_NET_PURE_PRODUCT_MARGIN_REPORT | None |
Knowing the dashboard name gets you nowhere near an API call, and a report type string with no dashboard context doesn't tell you which metric definition governs it. An agent on the Amazon Vendor Central MCP resolves both in one lookup, then requests the report it needs. The Vendor Central MCP is built on the vendor side of Amazon's Selling Partner API; a brand that also sells as a third-party seller connects the Amazon Selling Partner MCP beside it.
When I asked our agent why sell-through dropped on a set of ASINs, it didn't guess. It resolved the question to the Inventory dashboard, the GET_VENDOR_INVENTORY_REPORT report type, and the sellThroughRate field inside it, then pulled the report. Some questions need two reports: Conversion divides by glance views, which sit in GET_VENDOR_TRAFFIC_REPORT, while ordered revenue and ordered units sit in GET_VENDOR_SALES_REPORT.
Amazon stopped publishing the Sales and Inventory EDI transactions and the Forecast EDI transaction after June 30, 2022. Traffic and Net PPM never had an EDI transaction; outside the dashboards, the API is the only way to pull them. If a question resolves to Net PPM, the margin-leakage guide picks up where this one stops. Here is what the agent returns for a margin question:
{
  "operator_question": "Which report do I pull to find products dragging my margin?",
  "resolution": {
    "dashboard": "Net PPM",
    "sp_api_report_type": "GET_VENDOR_NET_PURE_PRODUCT_MARGIN_REPORT",
    "view_required": "manufacturing",
    "metric": {
      "name": "Net pure product margin (Net PPM)",
      "definitions": [
        { "formula": "(shipped revenue - shipped PCOGS + CCOGS - sales discounts) / shipped revenue", "cited_section": "Net PPM dashboard" },
        { "formula": "(shipped revenue - shipped CCOGS + CCOGS - sales discount) / shipped revenue", "cited_section": "Metric glossary" }
      ],
      "conflicting_definition": true,
      "resolution_note": "The glossary's 'shipped CCOGS' reads as a typo for shipped PCOGS. Confirm which formula your internal reporting uses."
    }
  },
  "caveat_flags": ["excludes_warehouse_deals", "manufacturer_dashboard"]
}ARA and ABA are different products gated by different rules, so "I can't find my dashboard" means two different problems
Every vendor has access to ARA, with no Brand Registry requirement. ABA, Amazon Brand Analytics, is a different product: it requires Brand Registry enrollment and being the brand-selling party on the ASINs in question. Before the agent routes a question to a dashboard, it checks the question against those access rules from Atlas, so it doesn't send you looking for a dashboard your account cannot have.
The two products also measure different things. These ABA features have no counterpart in ARA:
- Search: search popularity, click share, and conversion share for a search term.
- Market basket analysis: the products bought together with yours.
- Repeat purchase behavior: order counts and unique customers over time.
ARA is built around sales and operational dashboards. Confusing the two doesn't just point you at the wrong tab; it points you at a feature set the product you're looking at doesn't have.
Amazon's own ARA docs define "Conversion" two different ways on the same overview page
The Conversion definition is the one that made me stop trusting my memory of ARA. The Traffic dashboard section of Amazon's ARA overview defines Conversion as ordered revenue divided by glance views. The General dashboard information section, on the same page, defines it as ordered units divided by glance views. Both are live documentation, and neither section mentions the other.
Rather than pick a side, the agent returns both formulas whenever a question resolves to Conversion, cites each one's section, and flags the metric as conflicting. If your internal reporting was built on one formula and a teammate pulled the other, you'd see two Conversion rates and no obvious reason why. A Skill your team writes can record which formula you report against.
Three out-of-stock metrics sound interchangeable and aren't. The agent keeps each as its own glossary entry:
- ROOS (procurable product OOS) considers procurable ASINs, a broader cohort than Rep OOS, so ROOS usually reads as a lower percentage on the same account.
- Rep OOS considers only replenishable ASINs.
- Sourceable Product OOS is OOS glance views on sourceable ASINs divided by total glance views, in the Manufacturing view only.
Sell Through Rate gets its own definition too: shipped units minus customer returns, divided by on-hand units plus received units. Here is what the agent returns for a Conversion question:
{
  "operator_question": "What does Conversion mean in my ARA dashboard, and which report is it in?",
  "resolution": {
    "dashboard": "Traffic",
    "sp_api_report_types": ["GET_VENDOR_TRAFFIC_REPORT", "GET_VENDOR_SALES_REPORT"],
    "view_required": "manufacturing",
    "metric": {
      "name": "Conversion",
      "definitions": [
        { "formula": "ordered revenue / glance views", "cited_section": "Traffic dashboard" },
        { "formula": "ordered units / glance views", "cited_section": "General dashboard information" }
      ],
      "conflicting_definition": true,
      "resolution_note": "Glance views come from the Traffic report; ordered revenue and ordered units come from the Sales report. Both formulas are current on the same page, so confirm which one your internal reporting matches."
    }
  },
  "caveat_flags": ["manufacturer_dashboard", "conflicting_definition"]
}Four recurring distortions make an ARA number look complete when it isn't
Amazon's help pages name four conditions that change what an ARA number includes. The agent attaches each one to the resolution as a caveat flag, so the caveat travels with the number:
- Warehouse Deals are excluded. ARA leaves Warehouse Deals sales out of its reported metrics, Sales and Net PPM included, because the vendor doesn't collect those proceeds. Your retail partners' internal tools may include them, so a reconciliation that counts them won't match.
- The account view gates metrics. Traffic, Net PPM, Forecasting, Sourceable Product OOS, and ROOS appear in the Manufacturing view only, so a Sourcing-view login won't show them. Amazon shows the Net PPM dashboard to manufacturers.
- Returns restate ordered revenue. Customer returns and cancellations are applied to ordered revenue based on the original date of the sale, so a return processed this month can revise ordered revenue for an earlier month.
- Mapping fixes lag. Once an ASIN mapping is corrected, it may take up to 14 days to reflect in the dashboards, so a fixed product can still look missing.
Net PPM also has two written formulas. Amazon's overview gives shipped revenue minus shipped PCOGS plus CCOGS minus sales discounts, divided by shipped revenue. The metric glossary writes the second term as shipped CCOGS, which reads as a typo for shipped PCOGS. The agent returns both with their sources, as in the margin example above, next to the excludes_warehouse_deals and view_required: manufacturing flags.
What happens next: put the routed report pull on an Agent Flow schedule
A routed answer names the dashboard, the report type, and the caveat flags, which is enough to run the same pull again. Amazon Agent Flow lands your vendor data in a private lake you own, next to the ads data behind the Amazon Ads MCP, and can run report pulls on a schedule. A recurring pull suits anything with a lag attached: an ASIN missing today may appear once its mapping fix propagates.
For questions that resolve to Net PPM, go to the margin-leakage guide. Routing tells you where to look; that guide is where you dig for the leak. The pattern under all four sections is the same: route the question to a cited, current answer before you build anything on top of it.
Next in the series: read glance views in the ARA Traffic dashboard to diagnose flat vendor sales.
Stop guessing which ARA report answers the question
Bring us the vendor-reporting workflow you want your agent to run. We'll map the Amazon Vendor Central MCP report pulls, Atlas grounding, the Skill your team writes for its reporting rules, and private-beta setup with you.
Run this workflow in betaWhat you need to run ARA report routing
- MCP
- Amazon Vendor Central MCP for the vendor retail analytics report pulls (GET_VENDOR_* report types)
- Skill
- No published Kuudo Skill covers ARA. Save your team's report routing, formula choices, and caveat rules as a user-owned Skill so every teammate gets the same answer.
- Atlas collection
- amazon_vendors (playbooks: Amazon Retail Analytics and Reports Overview; Amazon Retail Analytics Metric Glossary; Amazon Retail Analytics API Integration Guide; Brand Analytics Reports)
- Required subscriptions
- The Brand Analytics SP-API role on the Amazon Vendor Central MCP connection for GET_VENDOR_* report pulls. ARA needs no Brand Registry enrollment; ABA itself requires it.
- Last verified
- "2026-09-29T00:00:00.000Z"
What success and failure look like for ARA report routing
| scenario | success | failure |
|---|---|---|
| Operator asks which report answers a sell-through question | Agent resolves to the Inventory dashboard, GET_VENDOR_INVENTORY_REPORT, and the Sell Through Rate formula | A generic answer names a dashboard without the matching SP-API report type |
| Operator asks what Conversion means in ARA | Agent returns both formulas, each cited to its section, flags the definition as conflicting, and names both the Traffic and Sales report types | One formula stated with full confidence and no citation |
| ROOS mentioned alongside Rep OOS in a report | Agent keeps ROOS, Rep OOS, and Sourceable Product OOS as three distinct glossary entries | ROOS treated as a synonym for Rep OOS or Sourceable Product OOS |
Keep exploring ARA report routing
Use these companion guides to understand the inputs, follow-on analysis, and adjacent workflows behind this playbook.
- Find ASIN Margin Leakage with Net PPM
Once the agent names Net PPM as the dashboard, this guide is where you go hunting for the actual margin leak.
FAQ
What is the Conversion formula in Amazon Retail Analytics?
Amazon's own ARA overview page gives two different formulas in two sections: the Traffic dashboard section defines Conversion as ordered revenue divided by glance views, while the General dashboard information section defines it as ordered units divided by glance views. Both sections are current, so confirm which one your internal reporting matches before comparing numbers across teams. Through the SP-API, glance views come from GET_VENDOR_TRAFFIC_REPORT and ordered revenue and units from GET_VENDOR_SALES_REPORT, so Conversion needs both reports.
What's the difference between ARA and ABA?
ARA (Amazon Retail Analytics) covers sales and operational dashboards and needs no Brand Registry enrollment. ABA (Amazon Brand Analytics) covers customer buying and search behavior (Search, market basket analysis, repeat purchase behavior) and requires Brand Registry enrollment plus being the brand-selling party.
Do I need Brand Registry to see Amazon Retail Analytics?
No. All vendors, including manufacturers and authorized resellers, have access to ARA with no Brand Registry requirement. Brand Registry enrollment is only required for ABA. Pulling the ARA reports through the SP-API does need the Brand Analytics role on your developer profile.
What's the difference between ROOS and Rep OOS?
ROOS (procurable product OOS) considers procurable ASINs, a broader cohort. Rep OOS considers only replenishable ASINs, a narrower cohort. Because the ROOS cohort is larger, ROOS usually reads as a lower percentage than Rep OOS on the same account. Neither is the same metric as Sourceable Product OOS, which is a separate glossary entry (OOS glance views on sourceable ASINs divided by total glance views).
Which SP-API reports replaced the old EDI 852 sales feed?
Two of them. The X12 852 carried both sales and inventory fields, so its sales fields map to GET_VENDOR_SALES_REPORT and its inventory fields, such as sellable on-hand units, map to GET_VENDOR_INVENTORY_REPORT. Amazon stopped publishing the Sales and Inventory EDI transactions (X12 852, EDIFACT SLSRPT) and the Forecast EDI transaction (X12 830, EDIFACT DELFOR) after June 30, 2022. Traffic and Net PPM never had an EDI transaction.
Why doesn't my internal Net PPM reconciliation match ARA?
Check whether your internal totals include Warehouse Deals sales. ARA excludes Warehouse Deals from its reported metrics, Sales and Net PPM included, because proceeds from those sales aren't collected by the vendor. Internal tools your retail partners use may include them, so a report that counts them won't match ARA. Also check which Net PPM formula you use: Amazon's overview and its metric glossary write it differently.
I fixed an ASIN's catalog mapping, why is it still missing from my ARA dashboard?
ASIN mapping fixes can take up to 14 days to reflect in the dashboards. If the correction is recent, the ASIN may simply not have propagated yet rather than being missing again.