
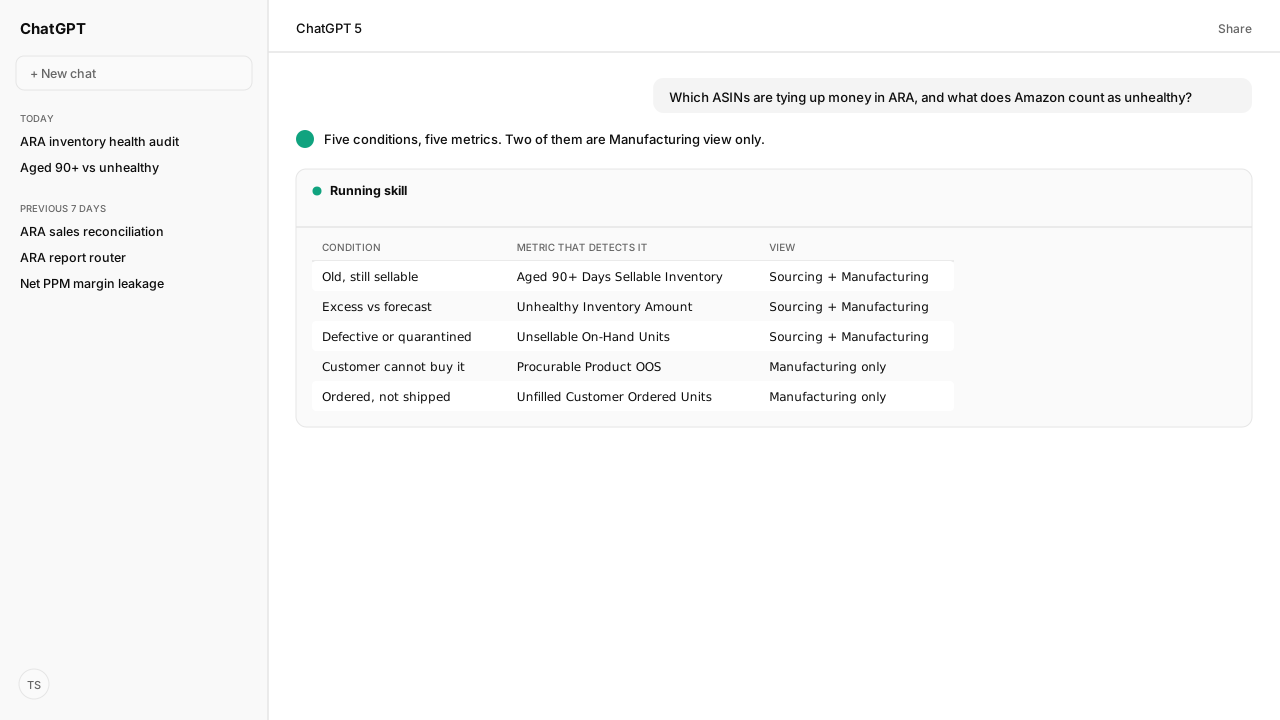
- Aged 90+ Days Sellable Inventory is a cost measure of how long stock has sat. Unhealthy Inventory Amount is the excess cost against Amazon's own forecast. Rank on unhealthy, break ties on aged.
- Unhealthy Inventory Amount is not available in the dashboard's custom or daily view, so the ranking runs on a standard period. On a custom range the column is absent rather than zero.
- Sellable on-hand is a physical condition recorded before outbound units are deducted. It does not mean the units are buyable on the website.
- The out-of-stock rate in ARA is procurable product OOS, a Manufacturing-view metric over a larger ASIN cohort than Rep OOS, which is why it usually reads lower. In the API it is a catalog-level rate only.
- GET_VENDOR_INVENTORY_REPORT carries aged and unhealthy cost per ASIN, as aged90PlusDaysSellableInventoryCost and unhealthyInventoryCost. The X12 852 EDI feed never carried them, and Amazon stopped publishing it after June 30, 2022.
- Weekly inventory data is due 72 hours after the week closes, by the end of Tuesday. That is Amazon's service level, not a guarantee, so a Monday run can find last week missing.
- Weeks of supply is an operator calculation, usable on-hand units divided by average weekly demand. The retired X12 852 weeks_supply_daily element has no API equivalent.
Rank Amazon vendor inventory health by Unhealthy Inventory Amount, the excess cost Amazon measures against its own forecast, and break ties on Aged 90+ Days Sellable Inventory rather than units on hand. An agent on the Amazon Vendor Central MCP pulls GET_VENDOR_INVENTORY_REPORT weekly, and a Skill your team writes labels each figure with its condition and view.
Amazon Agent Atlas grounds the ranking so "unhealthy" means what Amazon means by it.
Finance said three million dollars was sitting at Amazon and asked which Amazon Standard Identification Numbers (ASINs) held it. The Amazon Retail Analytics (ARA) Inventory dashboard answered with:
- four on-hand numbers on one page
- an out-of-stock (OOS) rate the vendor manager disputes
- a permissions error for half the team
Which ASINs tie up money, how fast are they moving, and can Kuudo return that answer every week?
ChatGPT, Claude, Perplexity, and Microsoft Copilot know nothing about your business out of the box, and your competitors use the same four tools. Kuudo gives those same tools your data, your rules, and your way of working: your account as it is right now, your judgment running every time, and your call before anything changes. Each part of the workflow has one job:
- The Vendor Central MCP supplies the live account and the authorized report pull.
- A Skill your team writes preserves how your team ranks excess.
- Amazon Agent Atlas applies the Amazon-specific grounding.
- Approval controls keep any downstream change with a person.
The Vendor Central MCP is built on the vendor side of the Selling Partner API. A brand that also sells on Amazon as a third-party seller connects the Amazon Selling Partner MCP beside it.
| Condition | Metric that detects it | View |
|---|---|---|
| Old, still sellable | Aged 90+ Days Sellable Inventory | Sourcing and Manufacturing |
| Excess against forecast | Unhealthy Inventory Amount | Sourcing and Manufacturing |
| Unsellable, can include recall quarantine | Unsellable On-Hand Inventory Units | Sourcing and Manufacturing |
| Customer cannot buy it | Procurable Product OOS | Manufacturing only |
| Ordered, not yet shipped | Unfilled Customer Ordered Units | Manufacturing only |
Atlas labels every on-hand column first, because sellable is a condition, not an availability
The first step is a label pass, before any calculation. Atlas retrieves the amazon_vendors Amazon Retail Analytics playbook, and the agent annotates every on-hand column with the condition that column counts and the day it is measured on, before anything gets ranked or divided.
Two properties of the dashboard set the clock. The Inventory dashboard lets you monitor the health of product inventory through weekly updates, so you can identify and respond to unfavorable trends. And the dashboard has no daily grain: not all metrics in the Inventory dashboard are available at daily granularity, so Amazon removed the option.
What sellable and unsellable on-hand actually count
The trap is the word sellable. In the Inventory dashboard, sellable on-hand units refers to the physical condition of the product as recorded in Amazon's inventory, before Amazon accounts for any outbound units such as customer shipments, transfers, or removals. Sellable inventory does not necessarily mean the units are available for sale on the Amazon website, only that they are not considered defective.
The glossary pins the measurement day: Sellable On-Hand Units and Sellable On-Hand Inventory, its cost form, are both counted in fulfillment centers on the last day of the selected period. The report schema adds one more caveat: backorders count as negative units and negative cost, so either figure can go below zero.
Unsellable is the mirror:
- Unsellable On-Hand Inventory Units is the number of units in Amazon's fulfillment centers in an unsellable condition on the last day of the selected period, and it can include recalled inventory quarantined for removal.
- Unsellable On-Hand Inventory is the same population expressed as cost.
A row with unsellable units is not automatically a quality defect, which matters later when the agent decides where that row goes. The label record below is illustrative, using the report's own field names:
{
  "reportOptions": { "reportPeriod": "WEEK", "distributorView": "SOURCING", "sellingProgram": "RETAIL" },
  "week": { "dataStartTime": "2026-08-23", "dataEndTime": "2026-08-29" },
  "columns": [
    {
      "field": "sellableOnHandInventoryUnits",
      "counts": "physically sellable condition",
      "measured_on": "last day of the selected period",
      "caveat": "taken before outbound units are deducted; backorders count as negative units",
      "is_not": "availability to buy on the Amazon website"
    },
    {
      "field": "unsellableOnHandInventoryUnits",
      "counts": "unsellable condition, can include recall quarantine",
      "measured_on": "last day of the selected period",
      "caveat": "not necessarily a quality defect",
      "is_not": "a demand signal"
    }
  ],
  "grain_note": "dashboard daily granularity removed; weekly update cadence"
}
One more thing the label pass reports, because an empty dashboard reads exactly like a healthy one. Users who are not administrators must have the "FinancialReports" task-based role enabled in order to access the Inventory dashboard. Admins have all rights enabled by default, and only an admin can enable or disable a non-admin's rights. The API pull has its own gate: GET_VENDOR_* reports need the Brand Analytics role on the SP-API connection.
A Skill your team writes ranks on unhealthy cost, because only that measure has looked at Amazon's forecast
Aged 90+ Days Sellable Inventory is the cost of inventory that is at least 90 days old and in sellable condition on the last day of the selected time period, with age counted from when Amazon received it. The glossary carries the same cohort as a unit count, Aged 90+ Days Sellable Units, and both sit at Sourcing and Manufacturing access. It measures how long stock has sat and nothing else.
Unhealthy Inventory Amount is the excess cost of inventory on the last day of the selected time period based on forecasted demand. Amazon has already measured the stock against its own forecast and handed you the answer as a dollar figure. The report carries both forms, unhealthyInventoryCost and unhealthyInventoryUnits, per ASIN. Amazon's schema notes that the forecast may already include some excess that makes economic sense to hold, so unhealthy is what sits beyond that.
Age and excess are independent, which is the whole reason the ranking needs two columns:
- Aged and not unhealthy: old stock the forecast still expects to clear.
- Unhealthy and not aged: stock under 90 days old that forecasted demand will not absorb. It stays out of the aged column until it reaches 90 days.
How the ranking is built: velocity, period, and sort order
The velocity column is Sell Through Rate, defined as units shipped compared to the units at Amazon's stores at the start of the period plus any units received during the same period, calculated as (shipped units - customer returns) / (on-hand units + received units). It is a Sourcing and Manufacturing metric on the Inventory dashboard, and the report carries it per ASIN as sellThroughRate, so it travels with the ranking rather than needing a second pull.
One constraint decides the period before the ranking runs. Unhealthy Inventory Amount is explicitly not available for the custom or daily view, so the Skill builds on a standard weekly period and declines a custom range, where that column is absent rather than zero. The sort is unhealthyInventoryCost descending, ties broken by aged90PlusDaysSellableInventoryCost descending: unhealthy ranks the dollars demand will not clear, aged ranks the dollars that have already sat.
The ranked list is the artifact finance asked for. The open purchase order (PO) units ride alongside so a row's exposure is visible next to its excess. The rows below are illustrative:
| ASIN | Aged 90+ cost | Unhealthy cost | Unhealthy units | Unsellable units | Sell-through | Open PO units | Read |
|---|---|---|---|---|---|---|---|
| B0EXAMPLE01 | $184,200 | $212,900 | 6,140 | 0 | 0.11 | 3,600 | Excess, still on order |
| B0EXAMPLE02 | $0 | $96,400 | 2,780 | 0 | 0.19 | 0 | Excess, not old |
| B0EXAMPLE03 | $71,500 | $0 | 0 | 0 | 0.44 | 0 | Old, forecast covers it |
| B0EXAMPLE04 | $12,800 | $0 | 0 | 1,410 | 0.31 | 900 | Not a demand problem |
The Read column is not a score, it is a lookup your team defines. The unsellable rule is evaluated first because that row leaves the demand question entirely:
| Read | Condition | What it means |
|---|---|---|
| Excess, still on order | Unhealthy cost above zero, open PO units above zero | Excess against forecast with confirmed PO units not yet received |
| Excess, not old | Unhealthy cost above zero, aged cost zero | Stock under 90 days old that demand will not absorb |
| Old, forecast covers it | Aged cost above zero, unhealthy cost zero | Sat 90+ days, still expected to clear |
| Not a demand problem | Unsellable units above zero | Unsellable condition or recall quarantine, routes elsewhere |
Sell-through and vendor lead time are modifiers on urgency, not ranking keys. A long Overall Vendor Lead Time in Days on an "excess, still on order" row means the conversation with your retail partner has to happen further ahead, not that the row outranks the one above it.
Any sell-through floor in this table is a threshold your team sets. Amazon publishes none, and the agent does not invent one. Read sell-through with its range in mind: the schema says it can be negative when returns exceed shipments, and above 1 when inventory sells while in transit between fulfillment centers.
Atlas keeps procurable OOS apart from Rep OOS, and ROOS is a Manufacturing-view metric
The vendor manager's number and the dashboard can both be right. The cohort is the difference, not the data.
ARA surfaces procurable product OOS (ROOS). Procurable Product OOS is the out-of-stock rate on all procurable products, calculated as ROOS = OOS GVs on procurable ASINs / total GVs, where GVs are glance views. It carries Manufacturing View access on the Inventory dashboard.
A procurable ASIN is a condition indicating whether Amazon can fulfill a customer delivery promise, considering the ability of known vendors to supply the ASIN in the foreseeable future, that is, whether Amazon can obtain the ASIN from a vendor without a purchase order delay.
Why Rep OOS and Sourceable OOS are different numbers
Replenishable OOS, the Rep OOS a vendor manager usually quotes, considers only replenishable ASINs. ROOS considers procurable ASINs. Because the ASIN cohort is larger for ROOS than for Rep OOS, in most cases ROOS will be the lower percentage. Two correct numbers, two cohorts, one argument that never needed to happen.
A third metric hides in the same neighborhood and is not the same thing. Sourceable Product OOS is a glance-views-based metric measuring retail availability for all ASINs with a sourceable retail vendor, calculated as Sourceable Product OOS = OOS Glance Views (GVs) on sourceable ASINs / total GVs, also Manufacturing View on the Inventory dashboard. Sourceable is not procurable, and the Amazon Retail Analytics metric glossary gives each its own row.
Why the ROOS column is blank in the Sourcing view
Then there is the blank cell. ROOS and Unfilled Customer Ordered Units, the number of units ordered or pre-ordered but not shipped, are not visible in the Sourcing view. Amazon calls that expected behavior: the data is only available for manufacturing vendors, because it is ASIN-level data that cannot be attributed to a specific vendor.
The API draws the line in a different place. In GET_VENDOR_INVENTORY_REPORT, procurableProductOutOfStockRate sits only in inventoryAggregate, the catalog-level section, while unfilledCustomerOrderedUnits appears per ASIN too. A per-ASIN availability column built from the report has no ROOS to read.
Manufacturing view is available only to manufacturers, and retail stakeholders own enabling it: your retail partner or a Contact Us case. The ARA Sales dashboard guide covers the view difference in general. Here, a blank availability column in Sourcing is a view state, not a data gap.
How do you calculate weeks of supply?
Calculate an operating estimate of weeks of supply by dividing usable on-hand units by average weekly demand for the same SKU and time basis:
weeks of supply = usable on-hand units / average weekly demand
For example, 1,200 usable units divided by average demand of 300 units per week equals four weeks of supply. Define "usable" before running the calculation. Sellable on-hand in ARA is a physical-condition measure recorded before outbound units are deducted, so it should not be treated automatically as inventory available for future demand.
Label the source and the demand window
Keep this estimate labeled as an operator-computed metric. The X12 852 EDI feed once carried weeks_supply_daily and days_supply_daily. Amazon stopped publishing that feed after June 30, 2022, and neither element has an equivalent in GET_VENDOR_INVENTORY_REPORT. Any weeks-of-supply figure today is your calculation, and it should carry a name that says so rather than passing as an Amazon field.
The demand window must also travel with the result. A trailing four-week average, a seasonal forecast, and the ARA Forecasting dashboard can produce different answers because they address different planning questions. A Skill your team writes stores the selected basis and your thresholds so the same rule runs each week, while Atlas supplies the Amazon-specific field definitions.
The Vendor Central MCP pulls GET_VENDOR_INVENTORY_REPORT, the one source of aged and unhealthy cost per ASIN
Amazon's own name for this pairing is "Inventory health & planning": the electronic data interchange (EDI) transaction was Sales (X12 852, EDIFACT SLSRPT), and the Selling Partner API (SP-API) report type is GET_VENDOR_INVENTORY_REPORT. Amazon stopped publishing the X12 852 after June 30, 2022, so the report is the route now.
The agent pulls it through the Vendor Central MCP by calling Reports_createReport with reportPeriod, distributorView, and sellingProgram, waiting on Reports_getReport, and reading the payload with Reports_getReportDocument. For a WEEK period, dataStartTime must be a Sunday and dataEndTime a Saturday.
The Amazon Retail Analytics EDI/API integration playbook maps the old Inventory elements to API names. Those names are not always the field names in Amazon's published report schema, so the table carries both:
| X12 element | EDI description | API name in Amazon's mapping | Field in the report schema |
|---|---|---|---|
ZA*QA | sellable_on_hand_units | sellableOnHandUnits | sellableOnHandInventoryUnits |
ZA*DG | quantity_damaged | unsellableOnHandUnits | unsellableOnHandInventoryUnits |
ZA*QO | quantity_oos | unfilledCustomerOrderedUnits | unfilledCustomerOrderedUnits |
ZA*QR | quantity_received | netReceivedUnits | netReceivedInventoryUnits |
ZA*ST | sell_through | sellThroughRate | sellThroughRate |
ZA*QP | quantity_on_order | openPurchaseOrderQuantity | openPurchaseOrderUnits |
The EDIFACT equivalents were QTY+145 for sellable on-hand units and QTY+21 for quantity on order. Note the third row: the EDI element is literally named quantity_oos, and it maps to the unfilled customer ordered units metric, not to any out-of-stock rate.
Now the part that decides the architecture. Amazon's mapping lists eight Inventory fields with no EDI element at all. Amazon publishes no crosswalk from the mapping page's names to the report schema, so we matched each one by its definition:
netReceivedInventoryCostandsellableOnHandInventoryCostunsellableOnHandInventoryCostaged90PlusDaysSellableInventoryCostunhealthyInventoryCostandunhealthyInventoryUnitsaverageVendorLeadTimeDaysandvendorConfirmationRate
The entire excess ranking from the section above is in that list, and the cost fields arrive as an amount with a currency code. The trade ran both directions. Six X12 852 elements have no API equivalent:
quantity_on_hold(ZA*HL)days_supply_daily(ZA*DS)weeks_supply_daily(ZA*WS)forecast_variance(ZA*FV)quantity_in_transit(ZA*QI)quantity_ending_balance(ZA*QE)
Those six went with the feed. Amazon's integration page still lets you manage supply-chain messages over EDI, but reporting runs on the API in parallel. The configuration below is illustrative, a sketch of what a Skill your team writes might hold:
# A Skill your team writes (illustrative)
# Runs on the Amazon Vendor Central MCP, grounded by Atlas (amazon_vendors).
report:
  type: GET_VENDOR_INVENTORY_REPORT
  reportOptions:
    reportPeriod: WEEK          # the dashboard omits Unhealthy Inventory Amount on custom and daily views
    distributorView: MANUFACTURING
    sellingProgram: RETAIL
  run_after: end of Tuesday     # Amazon's 72-hour service level for the prior week
calls:
  - Reports_createReport
  - Reports_getReport
  - Reports_getReportDocument
rank:
  section: inventoryByAsin
  primary: { field: unhealthyInventoryCost.amount, order: desc }
  tiebreak: { field: aged90PlusDaysSellableInventoryCost.amount, order: desc }
decline:
  - custom_or_daily_period      # Unhealthy Inventory Amount is absent there
  - unlabeled_availability      # every OOS figure carries its ASIN cohort and view
  - invented_threshold          # every cutoff is the operator's, stated as theirs
gate: require_human_approvalWhat happens next: run the audit weekly after Tuesday's data, with approval before anything changes
The audit becomes a recurring Skill your team writes, timed to the data rather than to a calendar habit. Amazon's service level for weekly inventory data is 72 hours after the Saturday close, by the end of Tuesday. It is a service level, not a guarantee, so the Skill checks the report's lastUpdatedDate and dates before ranking.
Each run compares against the prior week's list and calls out rows whose read changed, or rows that cross a threshold your team set. The list stays a recommendation until a person approves it. The Vendor Central MCP can acknowledge purchase orders, and that write waits for approval like any other. Removals and conversations with your retail partner stay with your team.
Five things leave this audit rather than sitting in it:
- Rows with unsellable units go to the returns and removals path, not the demand question.
- Excess sellable rows meet your purchasing terms, which can cap overstock undamaged or sellable returns as a percentage of cost or as a unit count per period, and set minimum and maximum units, value, and volume per removal order or return shipment.
- A blank ROOS or unfilled-units column forks to the view question, not to data.
- An ASIN that looks unowned forks to ASIN mapping. ASINs not properly mapped to ARA through vendor hierarchy, ASIN catalog attributes, and vendor group setup can populate inaccurately; the route is your retail partner or a Contact Us case requesting ASIN mapping assistance.
- The forecast behind the word unhealthy forks forward to the Forecasting dashboard, the subject of the next guide.
Amazon Agent Flow lands your vendor data in a private lake you own, beside the ads data behind the Amazon Ads MCP, so excess cost and advertising cost share a week-ending key. The ARA Sales dashboard guide reconciles the sales side. When the question is which dashboard or report type answers a metric at all, the ARA report and metric glossary guide routes it before this audit runs.
Amazon publishes every metric definition in this guide. What was missing was one ranked list that read the condition, the view, and the forecast before it read the total.
Next in the ARA arc: the forecast that decides what counts as unhealthy, turned into a production plan you can hold your factory to.
Rank your inventory the same way every week
Bring Kuudo the ARA inventory numbers the team keeps re-arguing. Kuudo will map the Amazon Vendor Central MCP report pulls, the Skill your team writes for its ranking rules, Atlas grounding, and private-beta setup.
Run this workflow in betaWhat you need to run ARA inventory health ranking
- MCP
- Amazon Vendor Central MCP for the vendor retail analytics report pulls: Reports_createReport, Reports_getReport, and Reports_getReportDocument against GET_VENDOR_INVENTORY_REPORT
- Skill
- No published Kuudo Skill covers ARA inventory. Save your team's ranking rules (condition and view labels, unhealthy cost first with aged cost as the tie-break, standard periods only, approval before anything changes) as a Skill your team writes.
- Atlas collection
- amazon_vendors, the rule corpus behind every claim here (playbooks: Amazon Retail Analytics; Amazon Retail Analytics metric glossary; Amazon Retail Analytics EDI/API integration; Purchasing terms)
- Required subscriptions
- A Vendor Central account with the Inventory dashboard and the FinancialReports task-based role for non-admin users, plus the Brand Analytics SP-API role on the Amazon Vendor Central MCP connection for GET_VENDOR_* report pulls. Manufacturing view is for manufacturers and is enabled by retail stakeholders.
- Last verified
- 2026-09-29
What success and failure look like for ARA inventory health ranking
| result | meaning |
|---|---|
| Unhealthy column empty on a custom range | Expected. The metric is unavailable in the custom and daily views. Rerun on a standard period. |
| ROOS and unfilled units blank in the dashboard | A view state, not missing data. Those are Manufacturing-view metrics, and Manufacturing view is for manufacturers only. |
| No per-ASIN ROOS in the API report | Expected. procurableProductOutOfStockRate sits only in inventoryAggregate, the catalog-level section. |
| Last week's inventory missing on Monday | Expected. Weekly inventory data is due by the end of Tuesday, 72 hours after close. |
| Dashboard will not open for a teammate | The FinancialReports task-based role is not enabled. Only an admin can grant it. |
| Aged cost above zero, unhealthy cost zero | Old stock the forecast still expects to clear. Not an excess row. |
Keep exploring ARA inventory health ranking
Use these companion guides to understand the inputs, follow-on analysis, and adjacent workflows behind this playbook.
Choose the dashboard, report type, and Amazon-defined metric before ranking inventory health.
Reconcile ordered and shipped demand before using sales to explain an inventory position.
Pull Vendor Retail Analytics reports through the vendor side of the Selling Partner API.
FAQ
Why is there no daily view in the ARA Inventory dashboard?
Not all metrics in the Inventory dashboard are available at daily granularity, so Amazon removed the option. The dashboard updates weekly. The GET_VENDOR_INVENTORY_REPORT API still accepts a DAY period, but the dashboard does not show Unhealthy Inventory Amount on a daily view, so rank on a weekly or longer period.
Why does Unhealthy Inventory Amount disappear on a custom date range?
Unhealthy Inventory Amount is not available in custom or daily views. Build the excess ranking on a standard period. On a custom range the column is genuinely absent, not zero.
How do you calculate weeks of supply for Amazon inventory?
Divide usable on-hand units by average weekly demand for the same SKU and time basis. For example, 1,200 usable units divided by 300 units of average weekly demand equals four weeks of supply. This is an operator-computed estimate. The X12 852 EDI feed once carried a weeks_supply_daily element, but Amazon stopped publishing that feed after June 30, 2022, and the element has no GET_VENDOR_INVENTORY_REPORT equivalent.
Does sellable on-hand mean those units are available to buy on Amazon right now?
No. Sellable on-hand units describe the physical condition of the product as recorded in Amazon's inventory, before outbound units such as customer shipments, transfers, or removals are accounted for. Sellable only means the units are not considered defective.
What is the difference between Aged 90+ Days Sellable Inventory and Unhealthy Inventory Amount?
Aged 90+ Days Sellable Inventory is the cost of inventory at least 90 days old and in sellable condition on the last day of the period, an age measure counted from when Amazon received it. Unhealthy Inventory Amount is the excess cost on that same last day measured against forecasted demand. Stock can be aged without being unhealthy, and unhealthy without being aged.
Why is ARA out-of-stock rate lower than the Rep OOS a vendor manager quotes?
ARA surfaces procurable product OOS, calculated as out-of-stock glance views on procurable ASINs divided by total glance views. Rep OOS counts only replenishable ASINs, and because the procurable cohort is larger, ROOS is usually the lower percentage. They are different cohorts, not conflicting data.
Which ARA inventory fields have no EDI equivalent, and which have no API equivalent?
Amazon's EDI/API mapping lists eight Inventory fields with no EDI element, including aged 90+ days sellable inventory, unhealthy inventory, and unhealthy units, which match, by definition, the schema fields aged90PlusDaysSellableInventoryCost, unhealthyInventoryCost, and unhealthyInventoryUnits. Going the other way, quantity_on_hold, days_supply_daily, weeks_supply_daily, forecast_variance, quantity_in_transit, and quantity_ending_balance existed only in the X12 852 feed, which Amazon stopped publishing after June 30, 2022.
Sources
- Report type values, Analytics (Selling Partner API)
- Amazon Vendor Inventory Report schema
- Amazon Retail Analytics (Vendor Central help, sign-in required)
- Amazon Retail Analytics metric glossary (Vendor Central help, sign-in required)
- Amazon Retail Analytics EDI/API integration (Vendor Central help, sign-in required)
- Purchasing terms (Vendor Central help, sign-in required)